The origins of fatigue testing date back as far as 1838, when German mining administrator Wilhelm Albert penned the first known paper on metal fatigue based on his mine hoist chain failure observations.1
By the 1850s, transportation professionals adopted fatigue testing as a tool for identifying, explaining, and ultimately correcting cracks in horse-drawn carriage axles and railroad car axles.1 His 20-year load-cycles-to failure study on the latter catapulted August Wӧhler, a German railway engineer, into the spotlight as a foremost authority on fatigue testing.
In fact, Wӧhler is credited with developing the S-N Curve (or, Wӧhler Curve) which is still used today to minimize fatigue by lowering the stress at critical points and identifying surface defects and resulting crack growth. This data is critical to understand due to the tendency of cracks, during low load/long duration fatigue testing, to cause failures at stress levels far below the published strength values because cracks are weaker than the bulk strength.
Crack growth theory explains that when a strain is applied to the crack, the tip surface yields which creates more surface. The surface then collapses, making the crack longer. At elevated temperatures, the yield stress is lower and the crack tip will yield more easily. As a result, the crack propagates more quickly which contributes to cyclical fatigue at higher temperatures and failures at lower cycles — a detriment to automotive engineering.
S-N, or Wӧhler, Curves consist of the following variables:
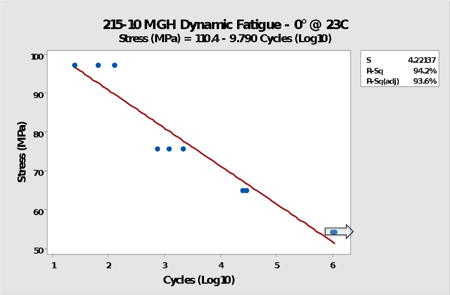
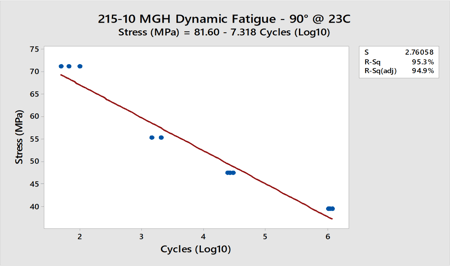
The goal of the fatigue testing process is to determine the fatigue resistances and identify the endurance points - where failure no longer occurs. To illustrate, the two graphs below detail the extreme ends of fiber orientation from a full S-N plot characterization completed on a fiberglass and mineral filled polyamide 6,6 under uniaxial stress for over 1MM cycles with fiber orientations of 90, 30, and 0 degrees.
Not surprisingly, the majority of automobile manufacturers now require S-N curve fatigue data plotting the magnitude of stress vs. the number of cycles to failure.
ASTM D7791 is the standardized test for determining the fatigue resistance of plastics under uniaxial stress for a large number of cycles. However, comprehensive fatigue testing of thermoplastics require:
While requirements are specific, there is substantial latitude in test parameter selection to allow users to closely replicate actual exposure conditions. As a result, automotive manufacturers each have their own set of parameters that can either simplify or complicate testing.
It’s important to note that regardless of fatigue testing methodology, the correct temperature must be selected to ensure S-N Curve data is accurate.
Complicating matters is the fact that ASTM D7791 does not specify a testing temperature. To keep results from being too erratic, it’s generally accepted that:
Transportation has come a long way since horse-drawn carriages and first-generation railroad cars, but that doesn’t negate the relevance of fatigue testing. Today’s automotive engineers are placing more and more importance [TG1] on the data generated by fatigue testing as they adopt lightweighting strategies and the use of engineering thermoplastics to comply with fuel efficiency and emissions standards.
Thermoplastic composites with a high strength to mass ratio make lightweighting possible. Short glass fiber reinforced thermoplastics are of specific interest since they can be injection-molded into complex shapes, in large volume, for a relatively low cost per part.
However, the process of injection molding causes fiber orientation, which gives rise to anisotropic mechanical strength and failure. Automotive engineers can use fatigue testing and computer modeling to predict the fatigue life of their plastic parts and make changes to the design to meet requirements.
The foundations and longevity of fatigue testing underscore its importance in the industrial sector, especially within industries like automotive which is transitioning to new materials and processes for doing things. Fatigue testing is generally very expensive and time consuming, so it makes sense to partner with an experienced plastic material solutions provider like Teknor Apex to leverage proven capabilities and solutions.
Reach out to the Teknor Apex team to discuss your needs, and keep an eye out for more articles on fatigue testing. We’re taking a deeper dive to help you understand the need and practical application of this essential methodology as it relates to successful outcomes for manufacturers.